Waste Market Overview & Outlook 2019
$995
Click Image to Enlarge
Click Image to Enlarge
Click Image to Enlarge
Note: 2025 Report to be Released Soon
The Waste Market Overview & Overview for 2025 will be released in the coming weeks. It details the now $105 Billion US waste industry, its key players, business segments and the continuing evolution of the industry.
The Waste Market Overview provides a very detailed analysis of the entire waste industry, examining the key business segments, and the evolving role of the major players. It examines the industry top to bottom covering waste generation, collection, processing, recovery and disposal by revenue and volume. The report details the relationship of past and future pricing to capacity and demand for disposal and shows the increasing role of the private sector. Waste equipment and the emerging importance of e-waste, C&D recovery, organics and food wastes, tires and medical wastes are also examined in detail. An accompanying Excel file details waste generation, recovery, movement among states and disposal in landfills and conversion to energy by state, region and for the entire U.S. by year from 1992 through 2019 and includes projections through 2023.
-
Market Revenues by Segment
-
Waste Generation, Recovery and Disposal by Volume and Revenue
-
Collection, Processing and Disposal Markets
-
Geographic Distribution of the Market
-
Other Waste Management Segments & Emerging Markets
-
Competition in Waste Among the Major Players
-
Resource Recovery Markets by Commodity
-
Waste Management Equipment
Report: 363 pages, includes tables, charts and graphs.
View the Table of Contents, List of Exhibits, and List of Tables.
New Report Details the $76 Billion U.S. Waste Industry
Waste Market Overview & Outlook 2019
With all the bad news focused on the trouble with recycling it's easy to overlook the overall strength of the U.S. waste management industry which grew by nearly 4 percent last year to $76 billion. Waste Business Journal's 363-page report: The Waste Market Overview & Outlook 2019 details the industry, its business segments, key market participants, and how they interact with one another and the overall economy.
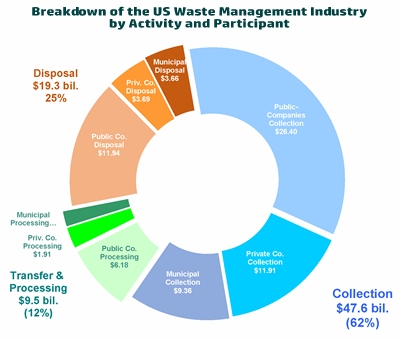
Last year the trend towards increasing privatization continued as publicly-traded companies accounted for 60 percent of industry revenues. That is up from less than 50 percent in the early 90s when municipalities accounted for 35 percent of revenues. Municipalities account for just 19 percent today. The business of waste is 62 percent collection, 12 percent recycling and transfer, and 25 percent disposal, which includes landfilling and to a much lesser extent, waste-to-energy.
Source: Waste Business Journal
Components of the Waste Stream
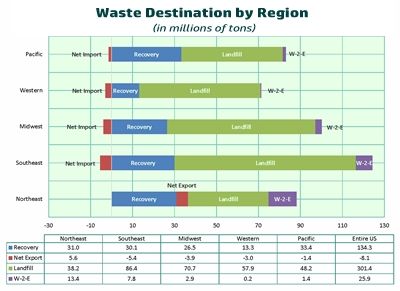
The report details with historical and projected statistics of four primary non-hazardous waste streams: municipal solid waste (MSW), organic wastes, construction and demolition debris (C&D) and non-hazardous industrial and special wastes. The report estimates that the U.S. generated 456 million tons, or 7.6 pounds per person of MSW last year. This figure is significantly more than U.S. EPA estimates, but Waste Business Journal figures are based on individual facility surveys of every waste processing and disposal operation across the country. That includes landfills, transfer stations, recycling facilities, waste-to-energy plants, composting operations and more.
Of that 456 million tons of MSW, we recycled (or composted) 29 percent leaving 301 million tons (66 percent) that was landfilled and 8 million tons (6 percent) that was burned for energy recovery. The U.S. imported 8 million tons from other countries, mostly Canada. Publicly-traded companies handled 58 percent of total landfill volumes, while private companies accounted for 14 percent and municipally owned landfills 28 percent.
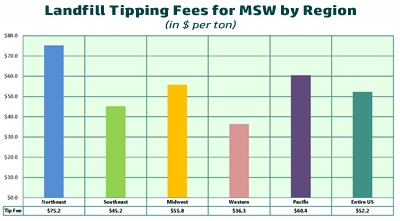
Pricing Increases…Companies Share the Added Costs of Recycling with Customers
Meanwhile, landfill tipping fees have grown steadily over the years in line with inflation, growing demand for disposal amid fewer landfills and because the big firms have exercised more pricing discipline in recent years by avoiding costly battles over market share. The national average tipping fee for 2018 was $52.20, up from $32.90 in 1998. WTE tip fees showed slightly more variability over the 20-year timeframe. Tipping fees vary widely be region and in accordance with the availability of landfill capacity amidst population density and demand for disposal. Prices have risen faster in the Midwest and southeast as waste is exported to these regions from the Northeast.
Source: Waste Business Journal
Increased Efficiencies through Vertical Integration
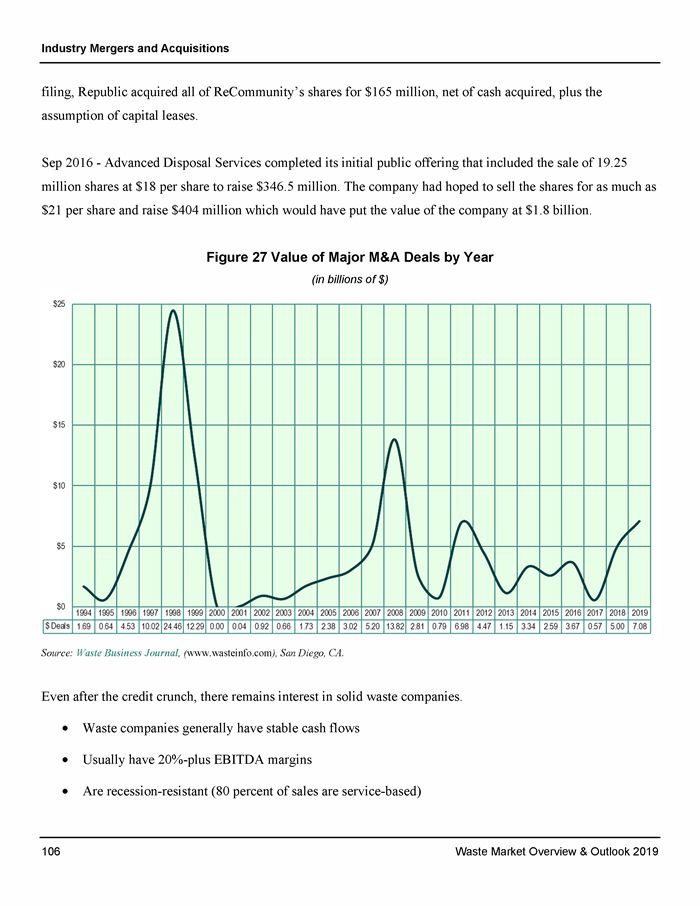
Recent mergers including Waste Management's proposed takeover of Advanced Disposal, promises a reshaped industry much further along its path of privatization and concentration. The companies understand that one way to deal with turbulent economic times amidst rising fuel, labor and equipment costs is to streamline operations and vertically integrate their markets. Integrated companies can better utilize their landfills by controlling a greater percentage of surrounding collection assets.
Landfill Capacity Expected to Contract Further… Especially in the Northeast
Landfills themselves are becoming more important as old sites close, demand for disposal steadily climbs, accelerated by recycled materials sent there that have been collected but have no market since China imposed much more stringent requirements. Consequently, remaining landfill capacity which has hovered around 20 years for the last decade, is expected to shrink to just 17 years by 2022. Landfill capacity is especially critical in the Northeast where capacity is expected to shrink to less than 10 years by that time.
Source: Waste Business Journal
Renewed Focus on Hedging Costs
Rising costs have focused company managers on disciplined price increases especially now that the industry is more consolidated, making them more attentive to return on invested capital, more rational about valuing existing landfill capacity and mindful of lessons in the past when pricing was sacrificed.
Past volatility of fuel costs and recent volatility in recycled commodity prices have led waste firms to share those increases with customers by adding surcharges to their contracts. Expect to see continued focus on controlling vehicle maintenance and insurance costs while investing in fleet upgrades and worker safety programs. Additional cash from operations will likely go towards "tuck-in" acquisitions, asset swaps and other vertical integration measures for which companies can reap immediate cost savings.
Relatively low natural gas prices together with a growing infrastructure of fueling facilities is leading companies and municipalities to invest in converting their fleets to compressed natural gas (CNG) and liquefied natural gas (LNG) powered vehicles. Other benefits including lower emissions and quieter engines makes the fleets more welcome to the communities they serve. While helping the collection profitability, low natural gas prices are hurting the waste-to-energy business. Only one new mass burn plant has been built since 1995 and many waste conversion plants proposing to use advanced technologies have either been discontinued, cancelled or put on hold.
Other Segments and Waste Streams Covered:
-
Construction and Demolition Debris Generation, Recovery and Disposal
-
The growing problem of E-Waste, Legislation, Processors and Solutions
-
Renewed focus on Organics and new Food Waste Programs
-
Scrap Tires, Recycling and Conversion to Energy
-
Waste Industry Equipment, Manufacturers and Segments
And much more…
Comprehensive Dataset Included
Included with this comprehensive and detailed 363-page report is an Excel dataset that includes historical and projected data on waste generation, recovery, exports, and disposal by landfill or WTE, remaining capacity and tipping fees for each major category of waste. The waste streams are broken out by MSW, organics, C&D, and industrial wastes. The statistics are aggregated by state, region and for the entire U.S.
Report Provided in Hardcopy and Electronic Formats, including a Spreadsheet!
In addition to the hardcopy, the report comes in three electronic formats: an Acrobat (pdf) file of the book, an Excel Spreadsheet with detailed data tables, and a PowerPoint presentation that contains both data and summary bullet points. The spreadsheet data is broken out by state, region and national and includes historical data back to 1991 and projections to 2023.
(363 pages. $995 - 365-day download access. If an updated version becomes available within 365 days of your purchase, you will have access to the new version too!)
ORDER NOW!
Waste Business Journal's
Waste Market Overview & Outlook 2019
(Data updated through 2018!)
Product package includes an Acrobat file of the full report, an Excel spreadsheet of the data and a PowerPoint presentation.
Book and CD-ROM package: $995.
TO ORDER call 619.793.5190 or: